In this blog posts I’m going to dive into a modern and a little bit technical way of doing song and songwriting analysis.
I’m going to look what information can be found from Ed Sheeran’s songs with the help of data from Spotify API.
If you want to skip introduction chapters of why, how and other jargon you can navigate straight to the results.
Why this is important?
A knowledge songwriters can get from this kind of a data & audio analysis are multiple in my opinion. Firstly, we’re producing a new information for songwriting studies here which is something I haven’t seen discussed that often. With a right dataset and analyst it’s possible to benchmark and compare songs or songwriters, find a common or surprising patterns, seek trends etc.
All new information is gold if you’re interested in this kind of stuff. And btw. in this case we’re talking about analyzing technical aspects of songs: length, BPM, audio image etc.
You will need interest for data to do this on your own but in general the stuff I’m presenting here is not a rocket science. In addition for basic data wrangling skills you need a bit of coding skills as well (Python for example) and data visualization skills is always a plus.
In this example I use and analyze data fetched from Spotify API. Spotify provides a pretty good set of tools for developers who are building apps and software for automated playlist creation for example. I used Python package Spotipy to get data easily from Spotify API.
Btw, I can help you.
Send me a message and I’ll help you to collect & analyze your song data from Spotify API.
Basics – What audio analysis & features data can you get from Spotify API?
In this example I use Ed Sheeran’s discography and songs to present what’s possible with Spotify API data. Ed Sheeran is a pretty good example since we all know he’s pretty awesome with songwriting and that’s what this blog is all about – learning songwriting. So it’s a good example to study more carefully.
As I mentioned already, I guess the primary use for Spotify API is to build applications which grow Spotify usage. That’s why many of the possibilities from API data are related to analyzing profiles of Spotify users – playlists, saved tracks, related artists etc. stuff you’d need to recommend music and know your customers better. But in this case study we’re not interested in Spotify users so much. We’re into a song data instead.
I’m mainly investigating the stuff you can find under the “audio analysis” and “audio features” labels.
Here’s the information available for a single song (not all listed here but those ones we’re most interested in):
Audio Analysis
- Bars
- Beats
- Sections
- Segments
- Tempo
- Key
- Time Signature
- Pitches
Audio Features
- Acousticness
- Danceability
- Energy
- Instrumentallness
- Liveness
- Loudness
- Speechiness
- Valence
So here’s lots of pretty interesting data available for our songwriting study purposes. You could actually go very deep with time series analysis and really learn how songs are written from this mechanical perspective. Actually one could even analyze music beat by beat or you can also analyze tunes in a way Spotify probably sees them (and automatically curate playlists, listening recommendations etc.).
The results
Okey, here’s what we can learn from fetching Ed Sheeran data from Spotify API.
First of all, I wrote a small program to connect Spotify API and navigate trough options. The end result in this case was just a simple export of csv -file with the selected data. With a rather small dataset like this one I usually prefer to build graphs with excel or Google sheets.
But the program itself looks like this if you’re interested. And if we seek Ed Sheeran from it, this is what you get as a result.
In this first step I actually use Spotify’s internal search for getting data from artist named ‘Ed Sheeran’.
There are some basic stats returned as:
- Spotify followers
- In this case there are 51 274 655 Spotify users following Ed Sheeran.
- Genres
- What genre the music by Ed Sheeran represents. I don’t have knowledge on this but I assume this can be edited by the admin of an artist account – or not.
- Spotify popularity
- Spotify popularity index (scale 0 to 100). Ed Sheeran’s rank is 96. According to Spotify API documentation the popularity metric means the following:
“The popularity of the track. The value will be between 0 and 100, with 100 being the most popular. The popularity is calculated by algorithm and is based, in the most part, on the total number of plays the track has had and how recent those plays are. Generally speaking, songs that are being played a lot now will have a higher popularity than songs that were played a lot in the past. Duplicate tracks (e.g. the same track from a single and an album) are rated independently. Artist and album popularity is derived mathematically from track popularity. Note that the popularity value may lag actual popularity by a few days: the value is not updated in real time.”
- Spotify popularity index (scale 0 to 100). Ed Sheeran’s rank is 96. According to Spotify API documentation the popularity metric means the following:
I’ve noticed that Spotify indeed gives higher popularity rankings for a new releases and artists that have released new music recently. So if you’re aiming to get your songs into automatically curated playlists or wonder how to get higher rankings in Spotify popularity index make sure you’re getting your listens now. That probably means it’s good to release songs frequently to stay relevant in the Spotify world.
But we all knew that already. There’s singles everywhere and nobody is interested in albums anymore.
So, what information else we can find?
Related artists
Spotify API lists 20 related for each artists and above is the list for Ed Sheeran. According to Spotify documentation this list is generated by how listeners of Ed Sheeran are listening other artists. I don’t know if this is an identical list for each country or are there any variations depending on where listeners live.
Artists popularity is calculated from all releases an artist has released in Spotify. No further information of how it’s actually calculated but I believe it’s also highly related to recent listens.
More information and technical documentation about related artists can be found here.
Top Tracks
Although we’re going to get and analyze all tracks from Ed Sheeran a bit later in this blog posts I’d like to note that you can get artist’s top tracks easily from Spotify API without doing work by yourself.
You could also get this information from each country individually if you think it would be useful. Some tracks may perform differently in different countries.
Get the full discography
Since the aim is to analyze the song data we need to download the information for the whole Ed Sheeran catalogue.
In this case I just simply collected the data of Ed Sheeran’s discography into a Pandas dataframe and exported that table as .csv -file.
Spotify API returned 285 individual Ed Sheeran songs. This obviously means same songs multiple times in different releases – singles, album version, special editions, live albums, remixes etc.
When I removed the duplicate tracks found from different releases and left only one track per song (the most popular in the Spotify popularity index) I ended up getting 89 unique Ed Sheeran tracks.
No idea if this is close to actual number what the Ed Sheeran song catalogue holds but at least this is what I got out from Spotify API. But in overall it seems to be a good export since I can find the songs and releases in Spotify when I go through the catalogue with my phone.
“Spotify Singles” (2017 – Castle on the Hill / Baby one more time) seems to be missing though, I don’t know the reason for this. Maybe that release is tagged wrong for this usage or something else. Anyways, it’s pretty common error that some data is missing.
If you’re interested to explore the data by yourself you can find it here (Google Sheets).
What can we found from exploring the dataset?
It’s a good practice to visualize your dataset first so you can get a basic undertanding of what kind of stuff you’re working with. Histograms are pretty common and usefuls graphs for this purpose.
I made a couple histogram graphs for the most interesting columns: popularity, song bpm, song durations, keys, time signatures, modes, valence, energy, danceability and acousticness.
Track popularity tells how well a singe track is performing in Spotify. The scale goes from 0 to 100 and it’s strongly related to recent streams.
As you can see pretty much all Ed Sheeran songs are performing quite well. There are a few very popular songs (Beautiful People & South of the Border) and the rest of the songs are not far behind either.
Interesting but not surprising point from here is that the highest performing tracks are from the latest release and the lowest performers are from older albums. That makes sense since Spotify appreciates fresh music. “No.6 Collaborations project” is performing very well at the moment I’m writing this post (October 2019).
From here we can find the distribution of beats per minute (BPM). There’s no really surprises here since most of the Ed Sheeran songs are quite easy-going. There are definitely more slow songs than fast ones.
The fastest song is “Way to break my hear (feat. Skrillex)” which goes 170 bpm. The slowest one is “U.N.I”, 74 bpm, from the album +.
Here you can find song durations in minutes. The presentation of this data is a little bit stupid in this case (I was lazy) since in this figure minutes are divided in 100.. but I believe you get the point. Most of the songs are a common pop songs from this perspective with a length of 3 to 4 minutes.
“Give me love” is an interesting exception with a length of almost 9 minutes. “Fire alarms” (2 minutes 24 seconds) is the shortest song in this dataset.
From here you can find the distribution of keys used in Ed Sheeran songs. The definition of keys accoring to Spotify API documentation is:
The estimated overall key of the track. Integers map to pitches using standard Pitch Class notation . E.g. 0 = C, 1 = C♯/D♭, 2 = D, and so on. If no key was detected, the value is -1.
It’s really interesting to see how extensively these songs are written in different keys. I’m quite sure it’s no coincidence and in my opinion it’s a clear sign that songwriting is taken very seriously here.
Many singer-songwriters end up repeating themselves eventually if there’s no interest in song arrangements. Writing and arranging songs for different keys is a good and simple trick to make songs stand out from each other even when there are same kind of elements used in songs otherwise.
Most of the Ed Sheeran songs goes in 4/4 time signature. There are six songs that goes in 3/4: “Even My Dad Does Sometimes”, “Dive”, “She”, “Hearts Don’t Break Around Here”, “Perfect” and “Make It Rain”.
The most interesting time signature is for song called “Wake Me Up”. It a ballad with piano and it’s seems that Spotify cannot find a clear rhythm signature for it so it’s labeled as 1 which probably means 1/1. I don’t know music theory that deep so I don’t know if 1/1 actually exist. Maybe some wiser can help me with this one someday.
Spotify categorizes tunes into two modes: major & minor. This dataset tells that majority of Ed Sheeran songs are written in major scales.
Not surprising if you have ever listened any of these tunes but it’s good to know that this stuff is easily available if needed for any other larger analysis.
One of the most interesting information you can get from Spotify API is track valence. A quote again from Spotify API documentation:
A measure from 0.0 to 1.0 describing the musical positiveness conveyed by a track. Tracks with high valence sound more positive (e.g. happy, cheerful, euphoric), while tracks with low valence sound more negative (e.g. sad, depressed, angry).
Interesting stuff, this metric is probably used somehow when creating mood playlists automatically in Spotify. In this case it seems that valence value is not that high for many Ed Sheeran songs.
The highest valence (0.94) can be found from song “Sing” and the lowest one (0.11) is “Give Me Love”.
Energy value is about tune intensity – speed, noise and loudness.
The documentation says that songs with very high energy levels can be usually found from death metal for example. When keeping that in mind Ed Sheeran’s singer-songwriter songs are actually quite energetic from this perspective.
This metric is probably also important when automatically curated playlists are generated in Spotify. Or at least the playlists I listen when I’m exercising seems to keep energy levels up quite well.
Dancebility value means what it says – danceability of a track. This value tells how suitable tracks are for dancing purposes. It analyzes tempo, beats, rhythm stability. Stuff that are needed when aiming to keep nightclub visitors entertained and thirsty.
The biggest dancefloor hit from Ed Sheeran discography is “Take Me Back To London” (0.83). Surprisingly the danceability of “Castle On The Hill” is only 0.46. People do love to sing and dance that chorus but maybe the song as whole is not that danceable from Spotify’s perspective.
Acousticness is the last example of the dimensions that are available for Spotify tracks. You can find the whole list from this documentation.
Acousticness is confidence metric that tells if a track performed acousticly. Again, pretty nice feature for playlist creators.
From the songwriting point of view it’s interesting how much instruments are used in Ed Sheeran records when compared to live shows. These songs work well when performed with an acoustic guitar (+ looper) and vocals but are usually recorded with a bit bigger arrangement.
What could be done with this data?
After you have your data collected it’s time to analyze and see if you can answer your questions and learn something new. In my opinion this is the most interesting part of this whole data thing but it’s something that comes only after you have your dataset ready, checked and in order. And that takes usually the most of the time.
In this small example we could try to see if there are any clear explanation for a track popularity. It’s not obviously the whole truth since there are so many reasons for it in real life but maybe we can find some hints what may have at least a small effect.
Scatter plots are useful charts when trying to find correlations between metrics. You will need to calculate correlation more carefully if you want to be sure but quite often visual graph is enough to at least get an idea if there could be something you’re interested in.
This graph visualizes track popularity and danceability. You can see that the trendline is slighty higher when the track popularity goes up. That means Ed Sheeran songs with higher danceability are a bit more popular than other songs in this dataset.
This graph is about song energy and popularity. The trendline is a bit steeper here than in the danceability image above. Songs with higher energy are listened more by Spotify users.
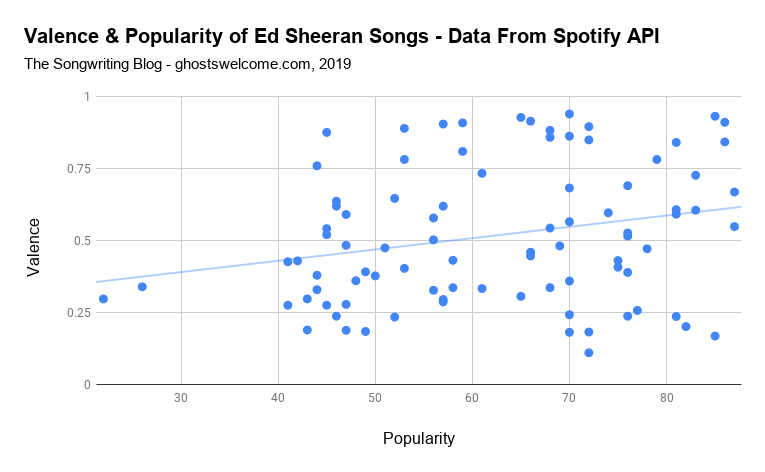
Is there any relation with track valence and popularity of Ed Sheeran songs?
If you you believe this image above then the answer is yes. Songs with higher valence (high valence = happy, cheerful, low valence = sadness, negativity) are the most popular songs in Ed Sheeran discography.
Reason for this – I don’t have any idea. You can figure it out by yourself if you’re interested.
Thanks for reading this far.
I enjoyed learning, investigating and writing this blog post. I know this was a long one but I hope you find this useful as well.
If you have your own music on Spotify and like to get this data out from your songs but don’t know how please send me a message. I can export your songs data for free though link to this blog from your website & social shoutout is highly appreciated.